Some of the equipment’s like tower or reactors are very critical equipment in refineries due to very high temperature and pressure. The temperature is also very high and coke tower works in the creep range for some duration of one full cycle. In such cases, creep along with fatigue plays a very important role in the failure of coke drums.
We will consider the example of coke tower having design temperature as 471 Deg. C and working temperature of 149 Deg. C at the top portion and 441 Deg. C at the bottom portion. Below is the histogram for the thermal loading for the top and the bottom portion of the code tower –
Thermal Histogram –
The skirt to shell junction i.e. Y forging is a critical portion of coke tower because it is highly susceptible to creep and fatigue simultaneously. API 579-1/ASME FFS-1 2007 is used for the creep-fatigue interaction in the present case. A non-linear transient thermal analysis is coupled with the elastic-plastic structural analysis for calculation of stresses and strains. These stresses are further used in deducing a creep damage factor and strains are used for deducing permissible cycles for fatigue as per the approach based on API 579-1. An MPC Omega method code is developed in the Finite Element Analysis Software ANSYS 17.2 for calculation of the creep damage factor and permissible cycles for fatigue. MPC Omega method code validated through manual calculation.
Now we will see analysis steps to calculate the creep-fatigue life of the equipment for thermal & pressure variation –
Transient Thermal Loading Conditions:
Loading for Thermal Loading –
Figure 1 – Thermal loading as per temperature histogram
Table 1 – Convection calculations for shell
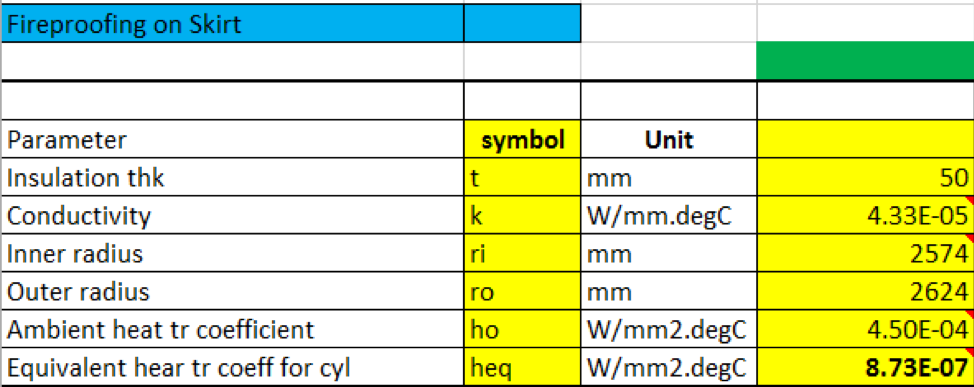
Table 2 – Convection calculations for the skirt
Transient Structural Analysis –
Loading & Boundary conditions for Transient Structural Analysis:
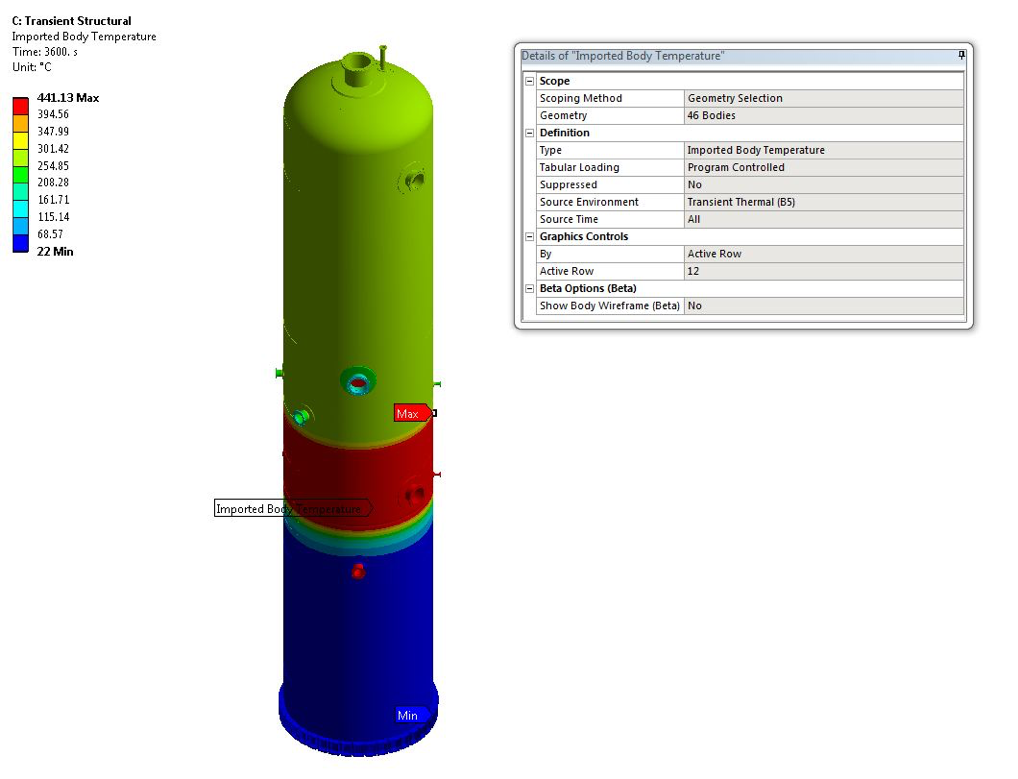
Figure 2- Imported Body Temperature
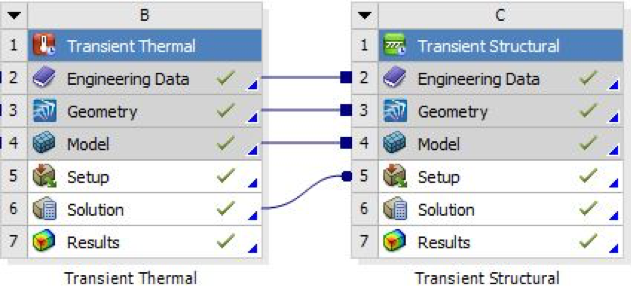
Figure 3- Coupled transient thermal + transient structural analysis layout
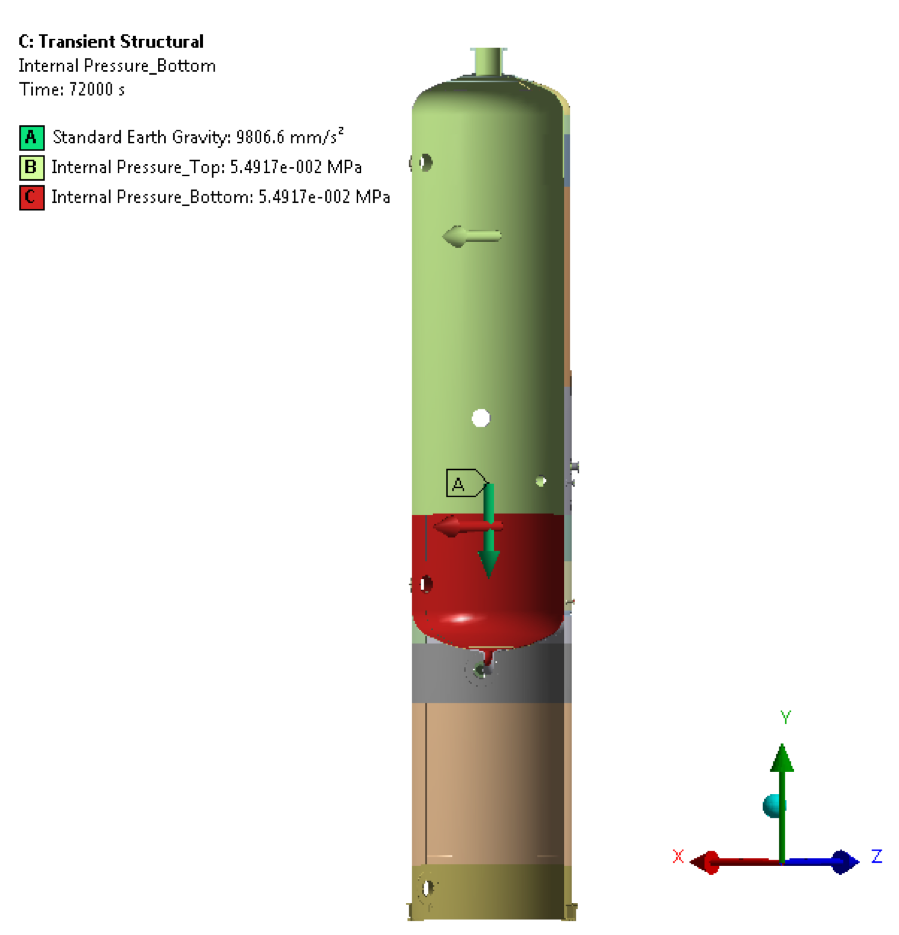
Figure 4 – Self-weight & Internal Pressure
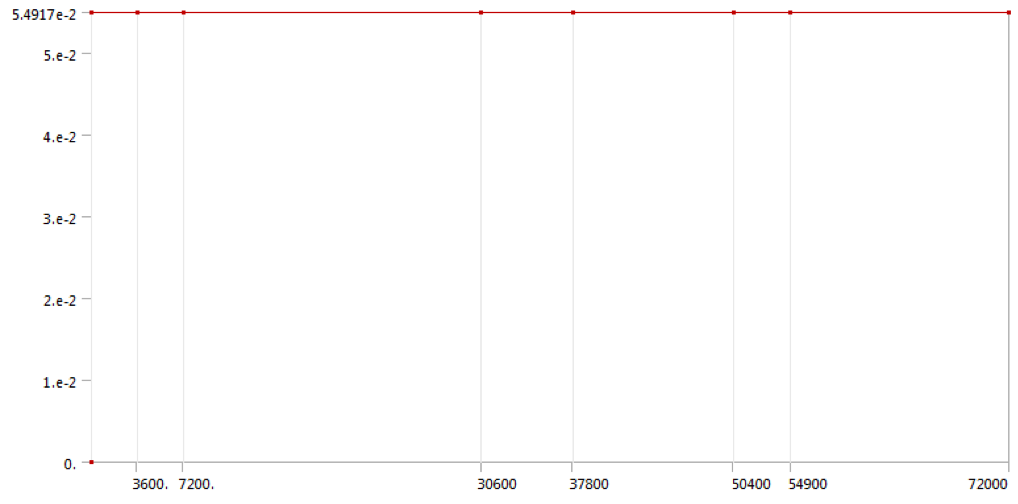
Figure 5 – Cyclic pressure for top/outlet section of tower
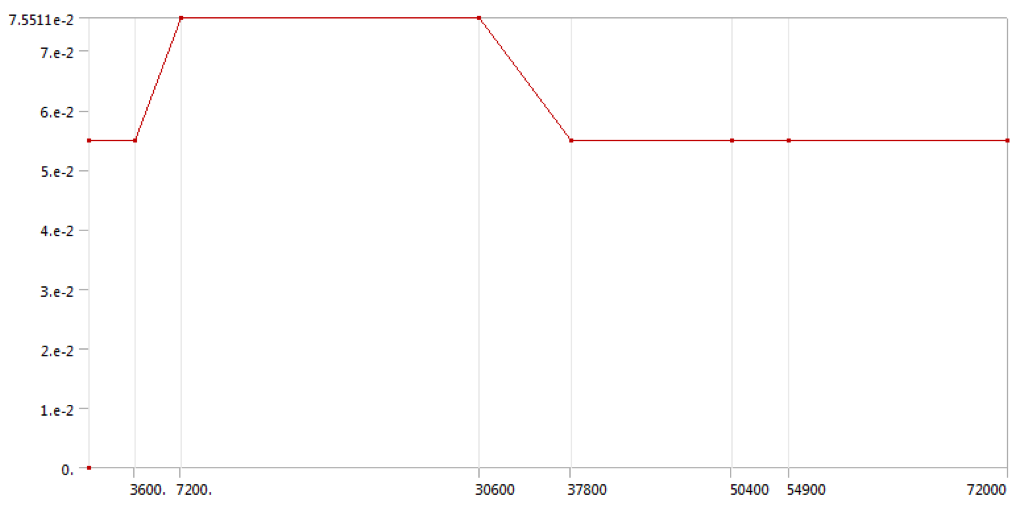
Figure 6 – Cyclic pressure for bottom/inlet section of tower
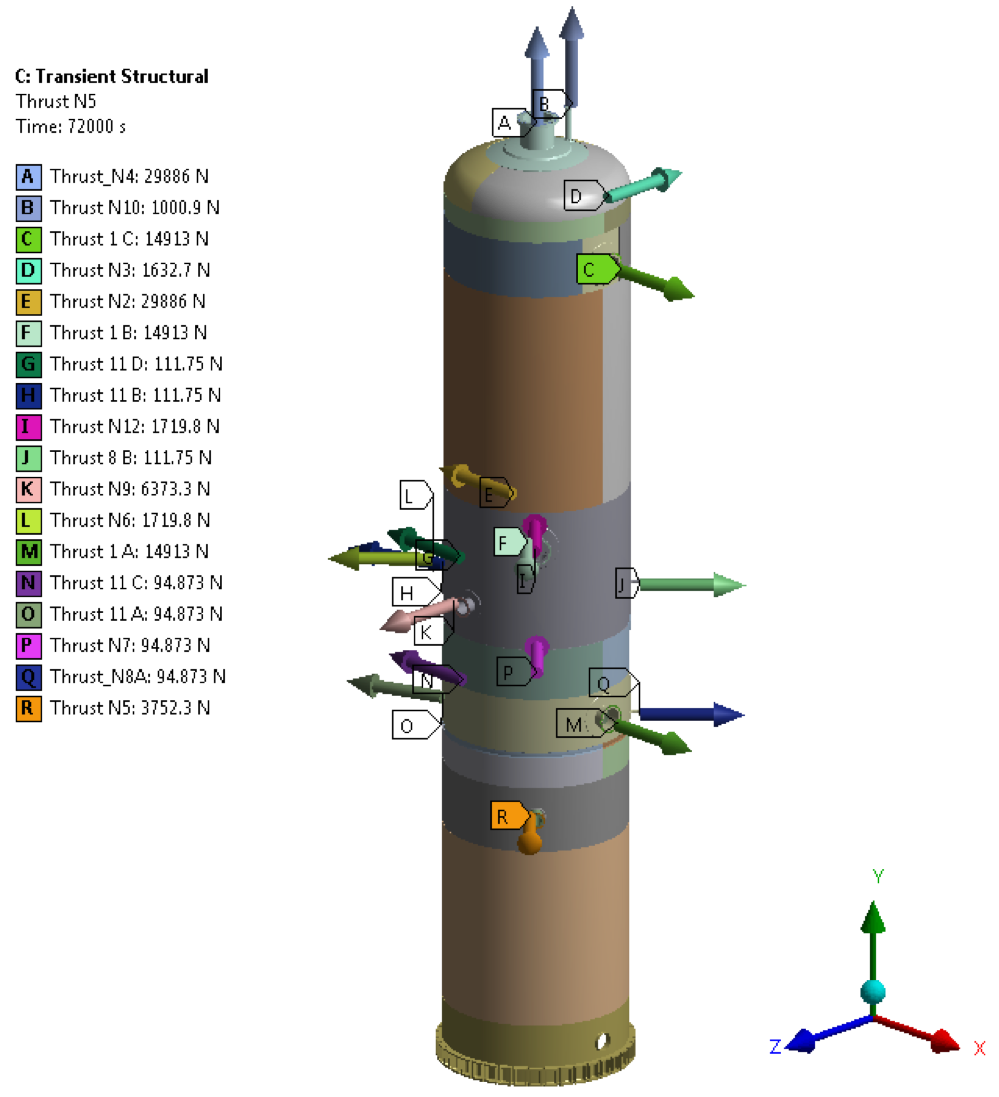
Figure 7 – Nozzle Thrusts
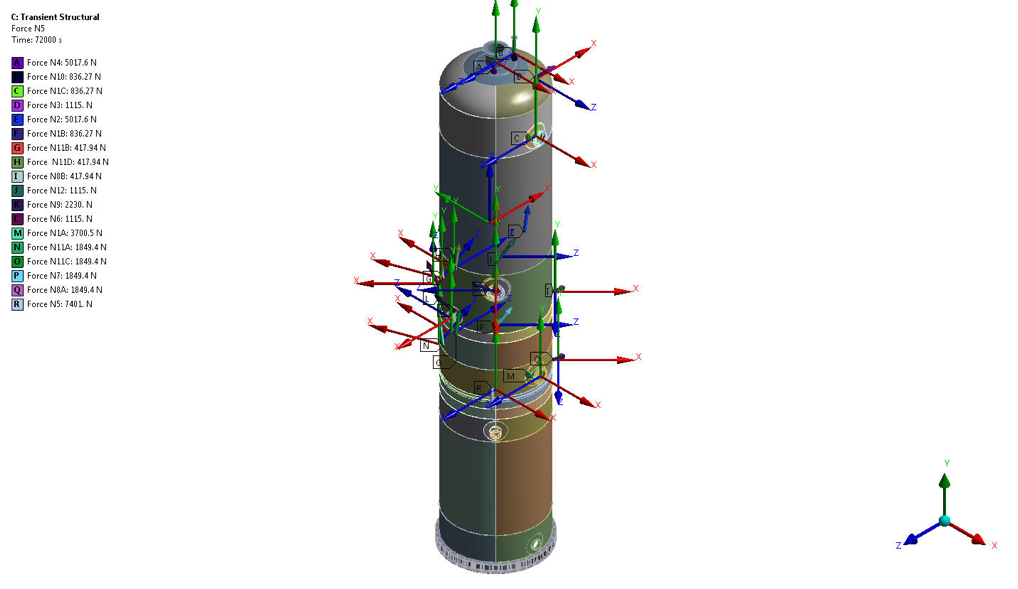
Figure 8 – Nozzle Process Loads
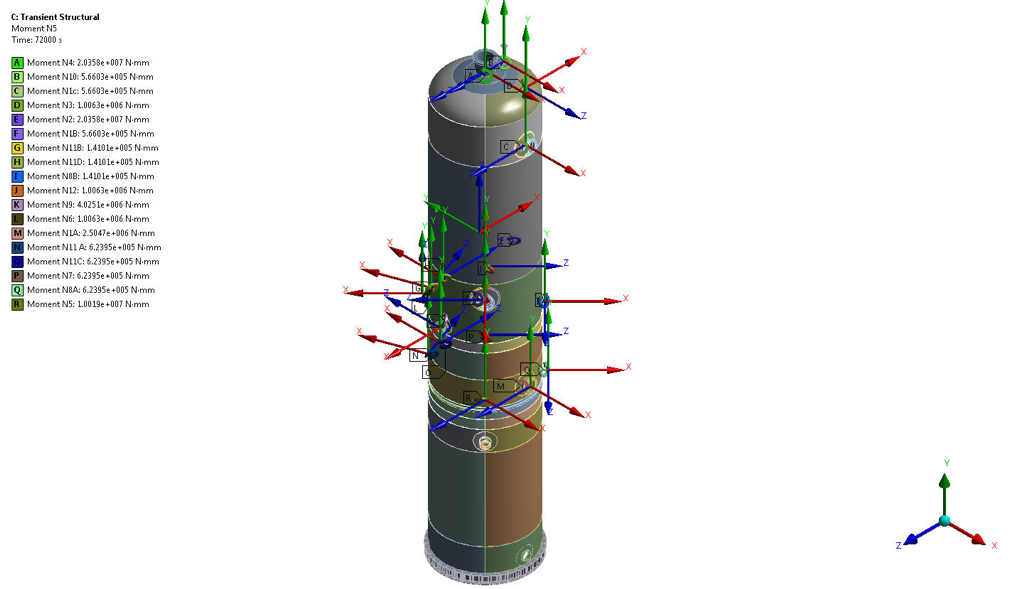
Figure 9 – Moment loads on Nozzles
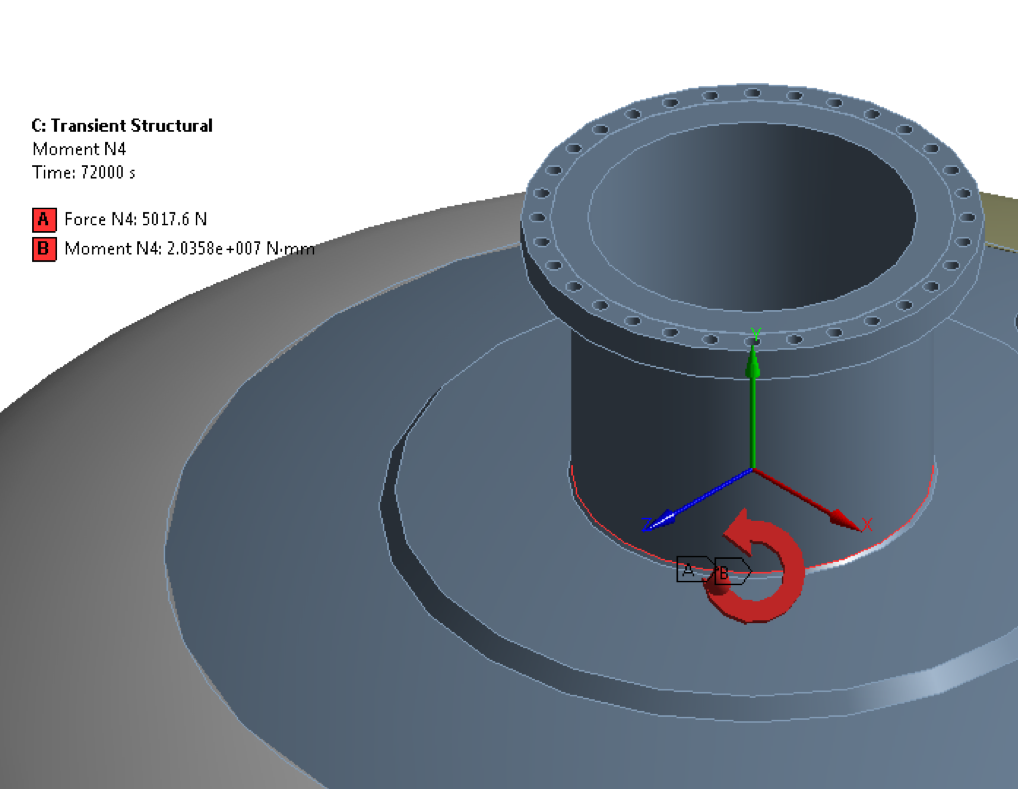
Figure 10 – Nozzle Force & Moment
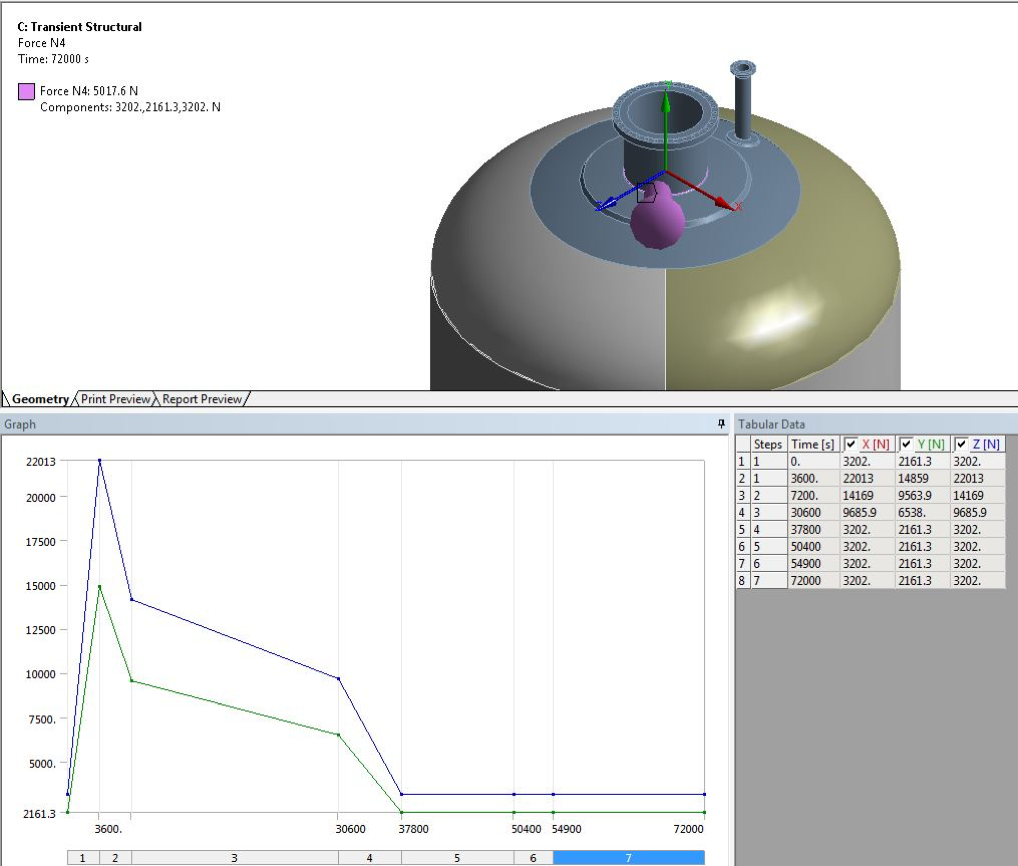
Figure 11 – Nozzle Force for Nozzle N4 – Detailed view of nozzle load loading
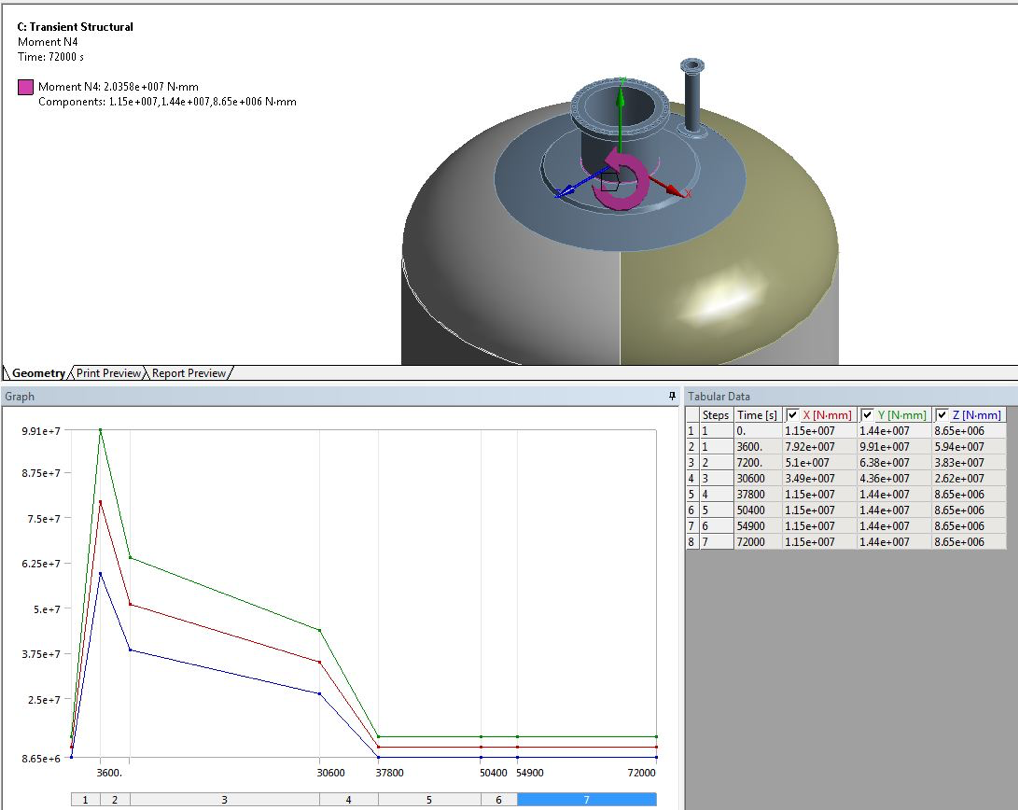
Figure 12 – Moment loads on Nozzles – Detailed view of moment loading
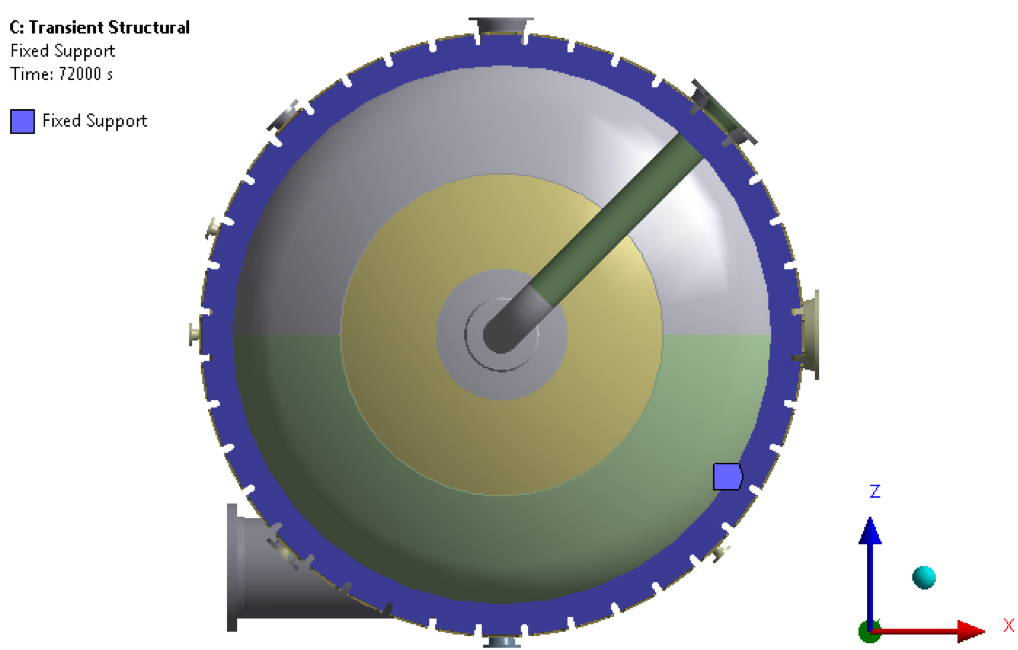
Figure 13 –Boundary Condition-Fixed Support
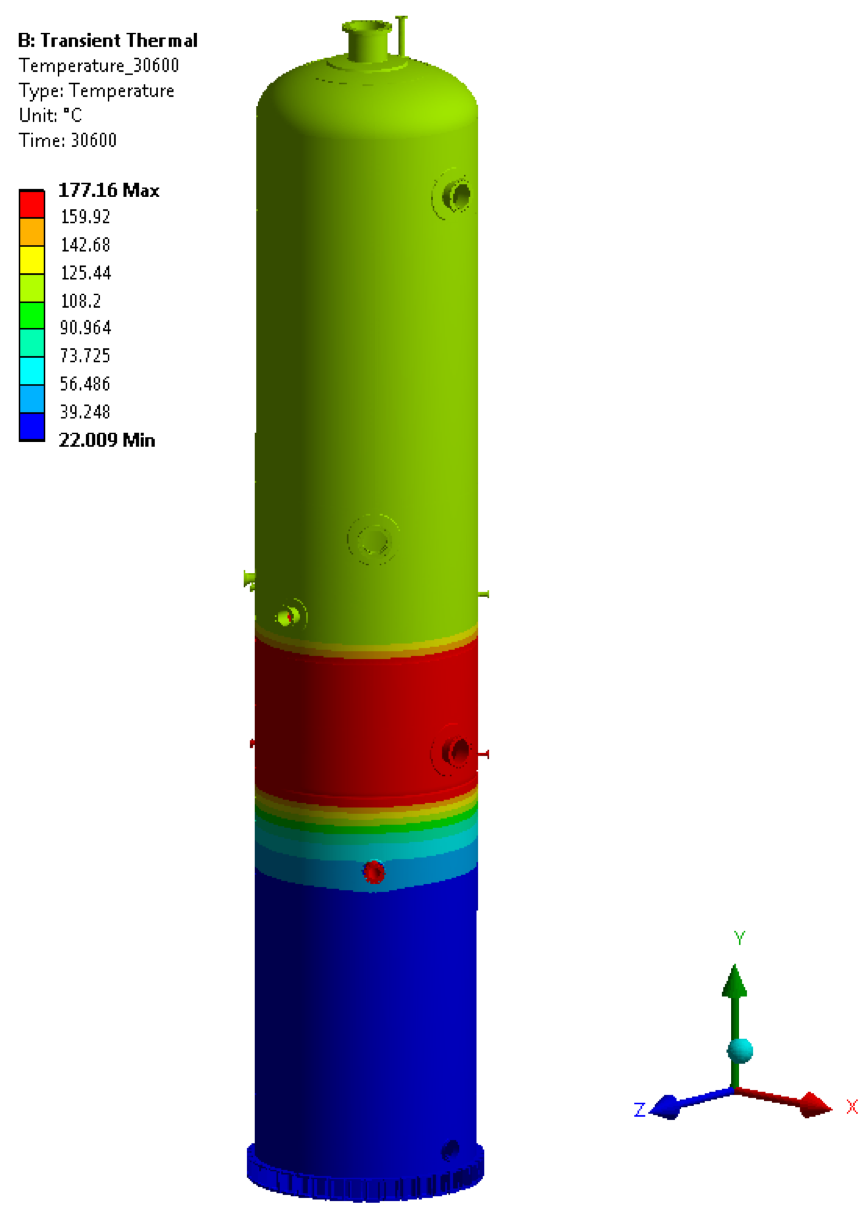
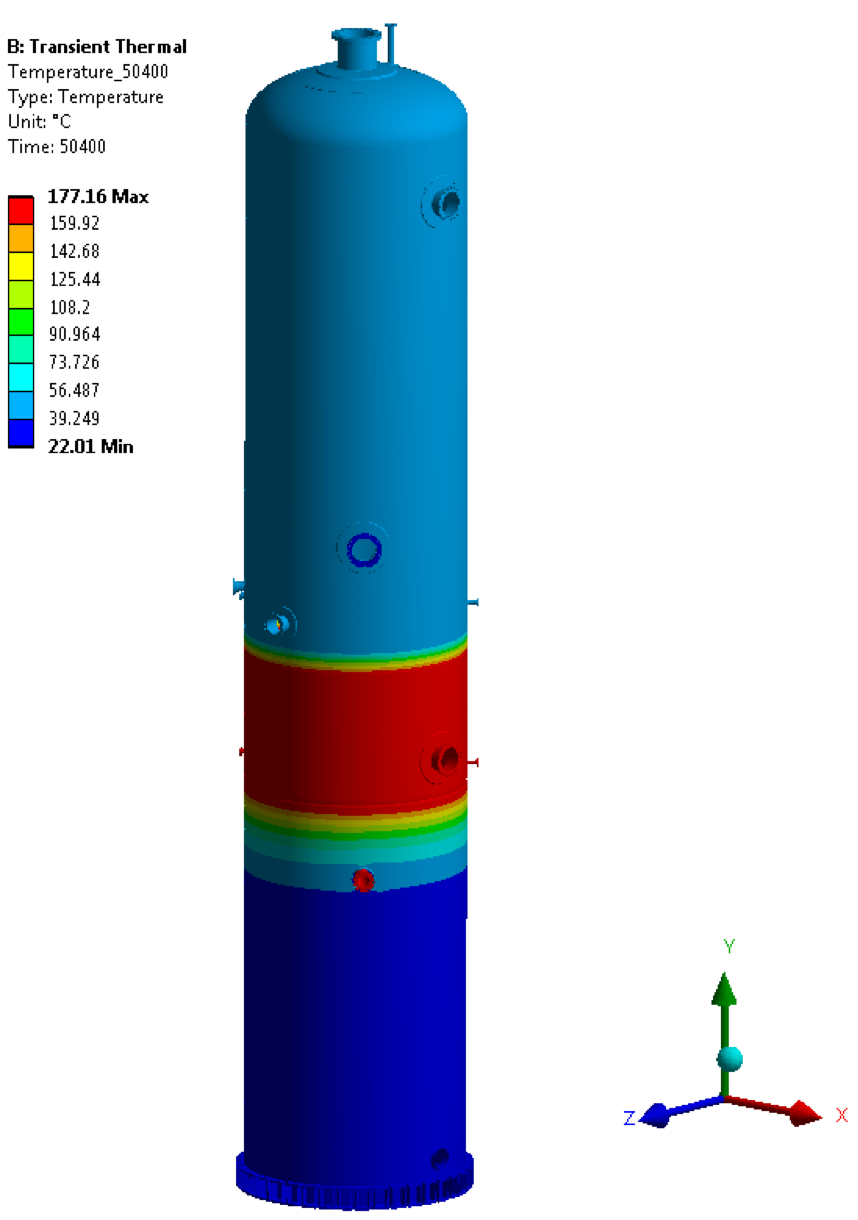
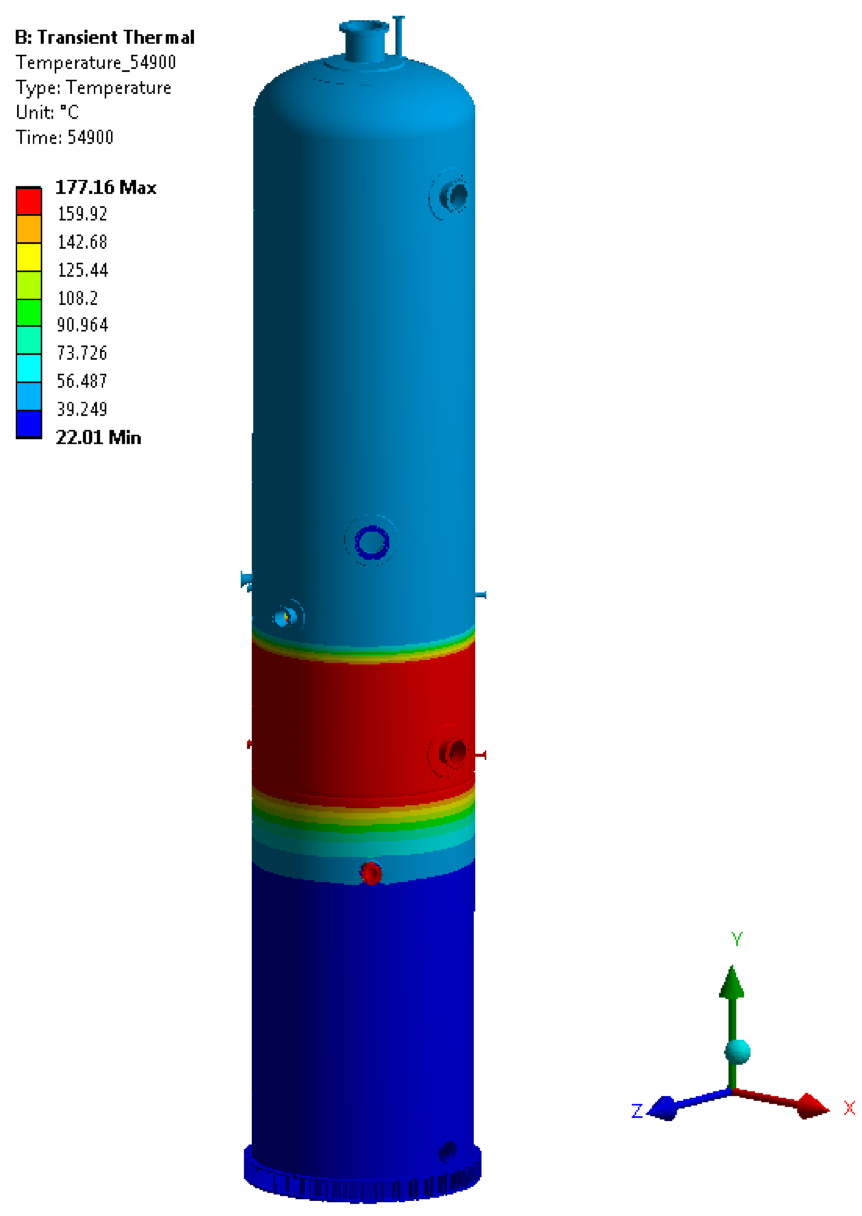
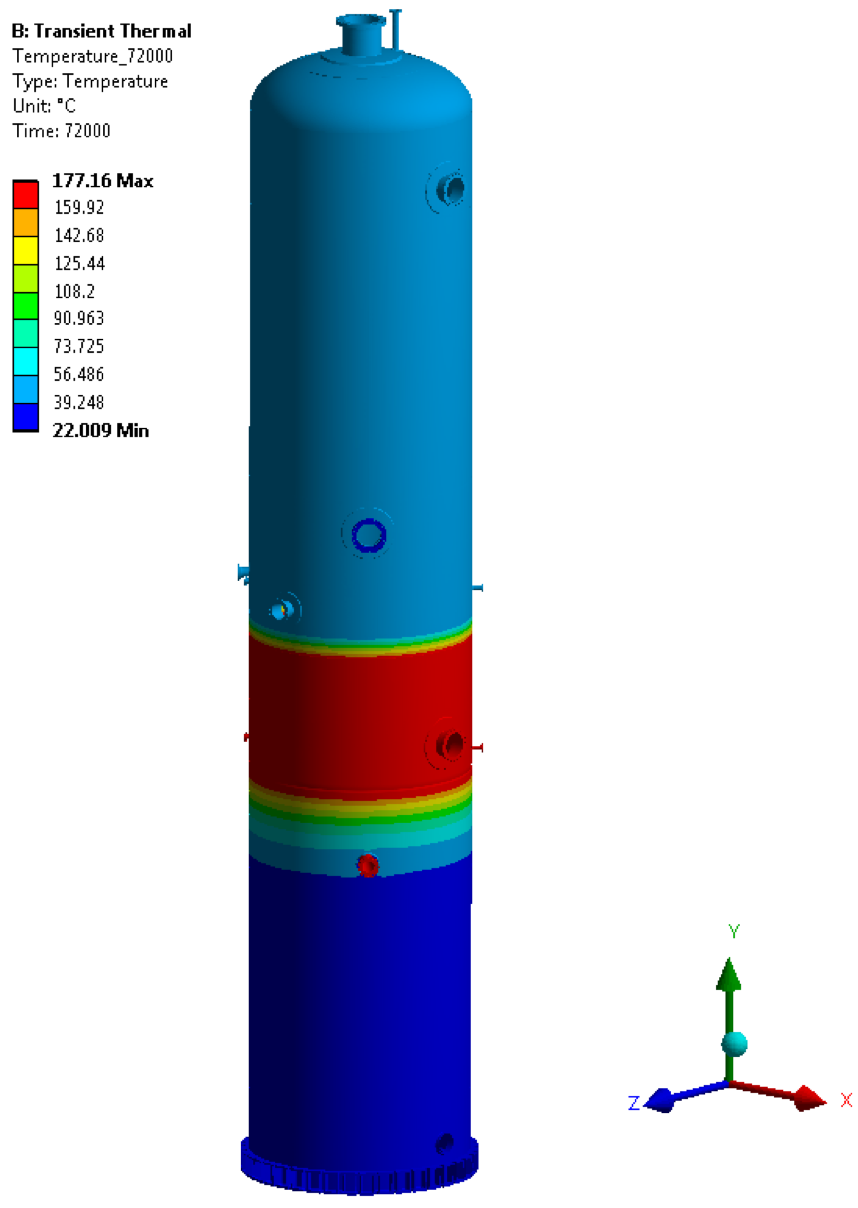
Transient Thermal Results
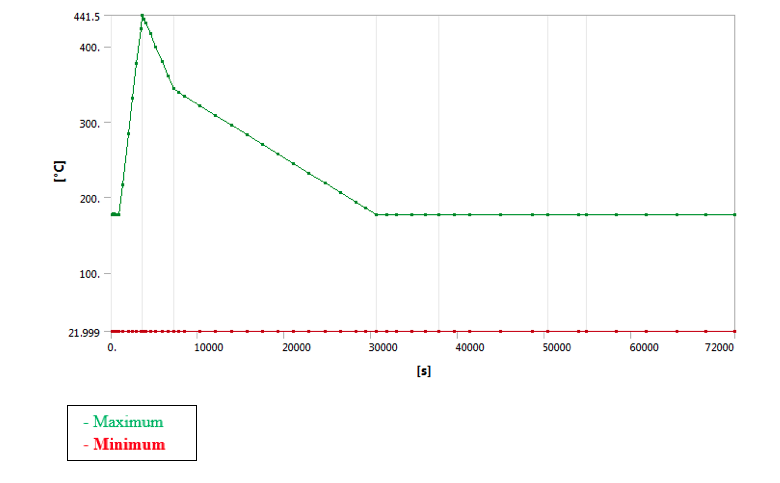
• Temperature Graph at all time step: –
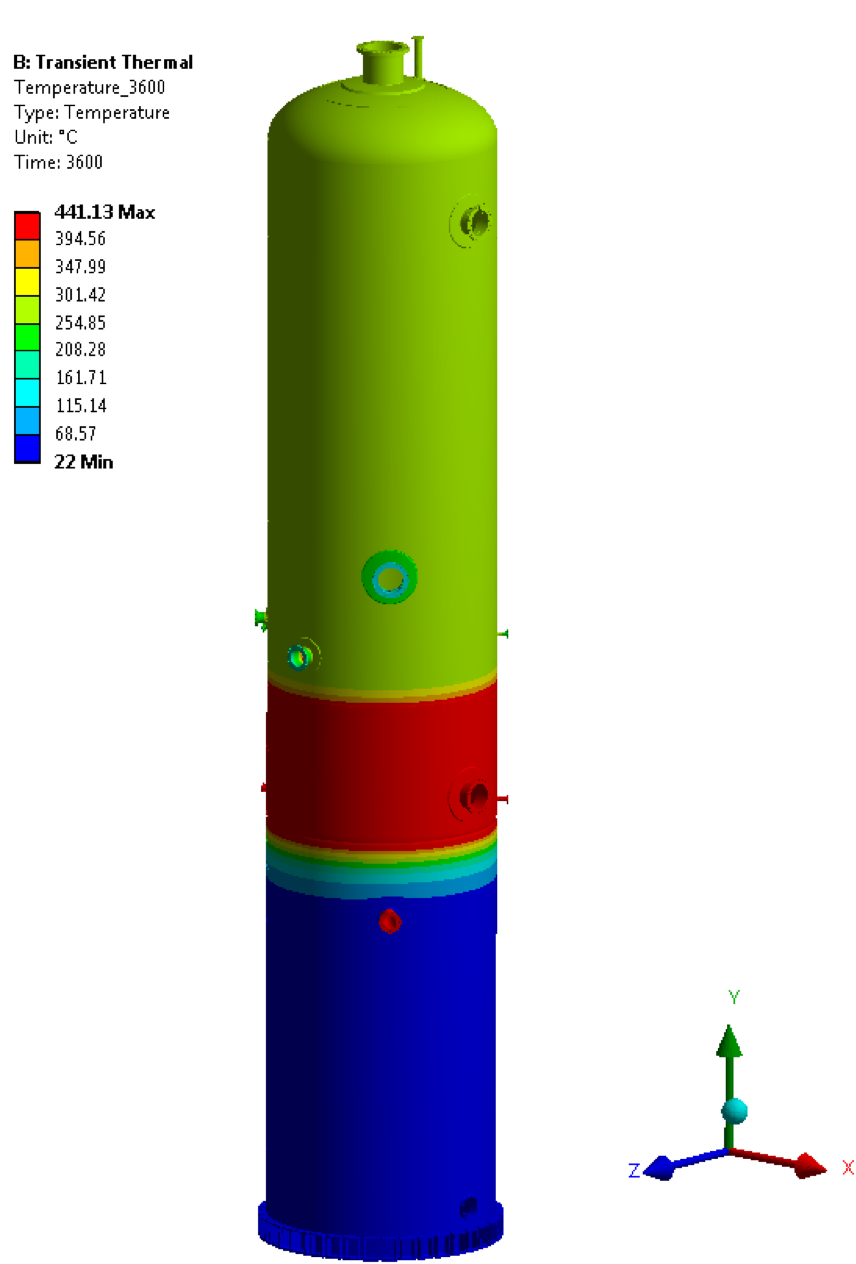
• Temperature @ 3600 sec
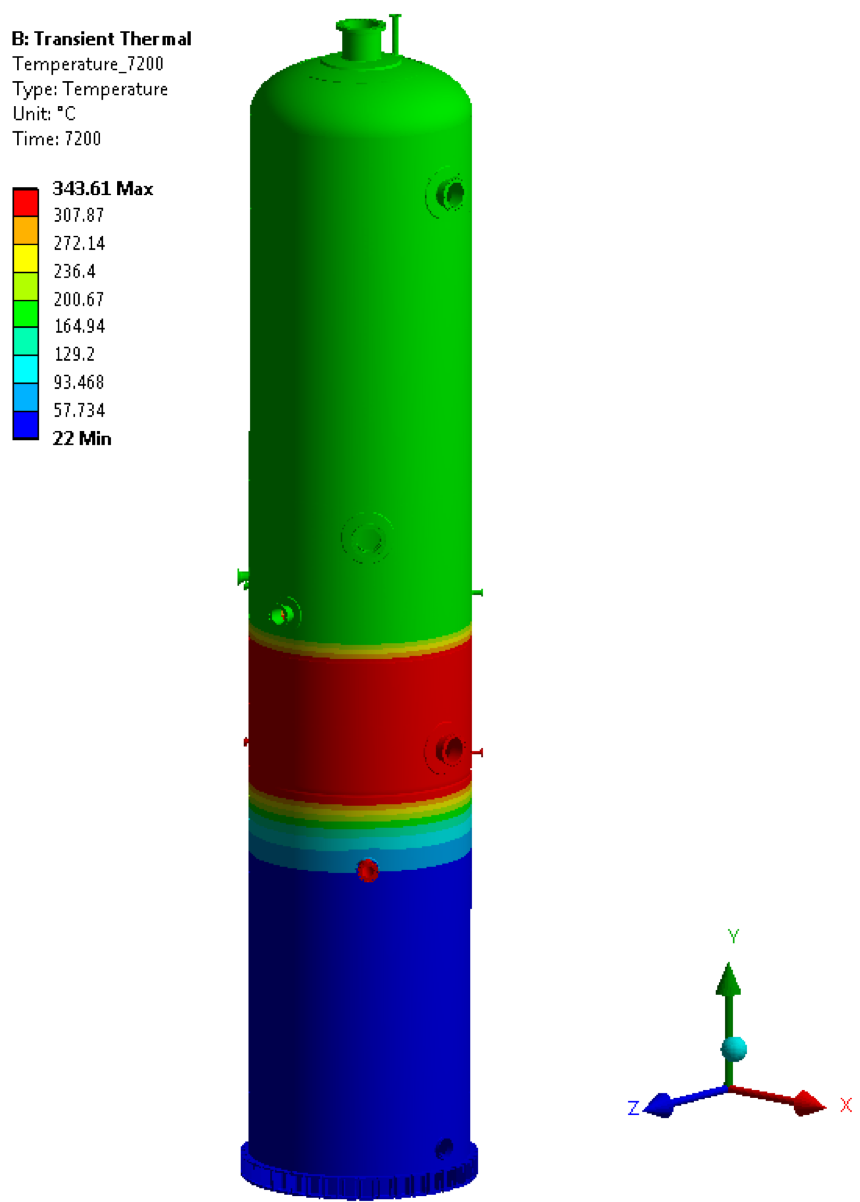
• Temperature @ 7200 sec
• Temperature @ 30600 sec
• Temperature @ 37800 sec

• Temperature @ 50400 sec
• Temperature @ 54900 sec
• Temperature @ 72000 sec
Coupled Transient Structural Results
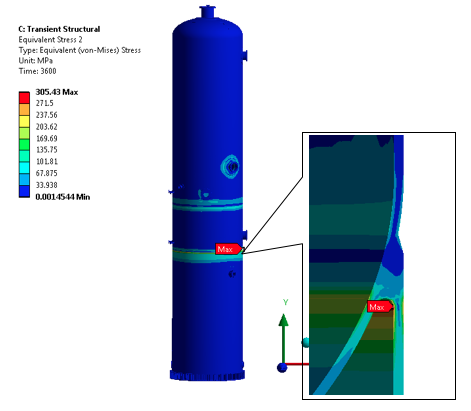
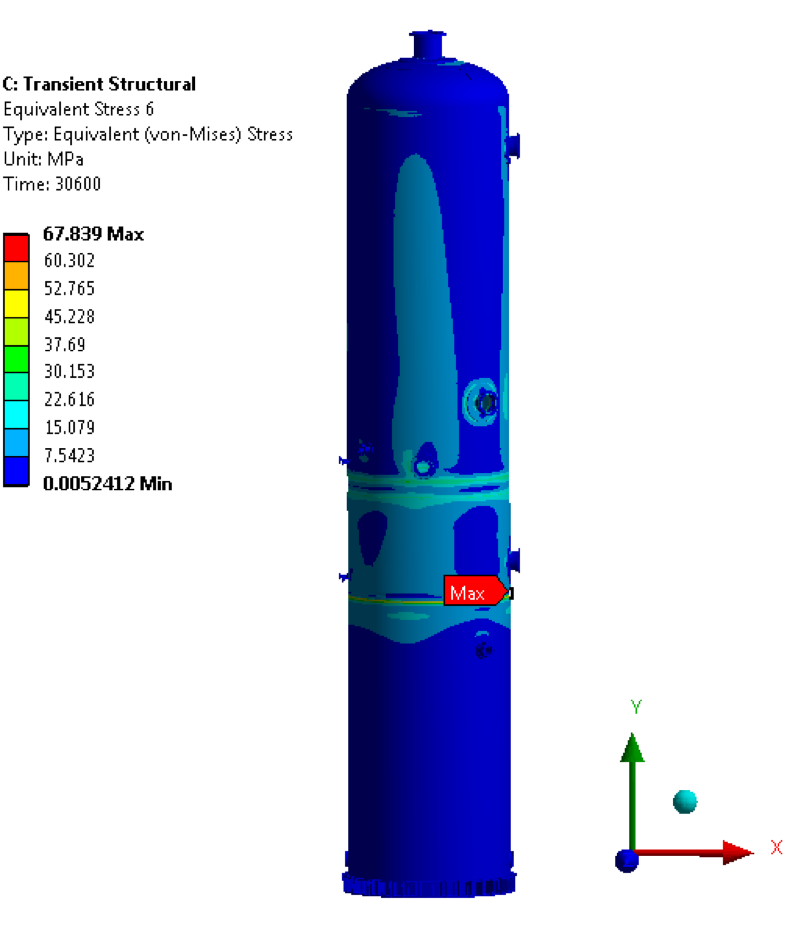
• Transient Equivalent von mises Stress plot for cycle
![]()
• Maximum Equivalent Von Mises Stress @ 3600
• Minimum Equivalent von Mises Stress @ 30600
Fatigue Life Calculation for Data Cases according to ASME Section VIII, Division 2, Part 5.
According to design data, design number of cycles are 400/year for cyclic temperature & pressure cycle, considering 20 years of design life, the total number of design cycles will be 8000.
From FEA maximum and minimum stress for the cycle are 305.42 MPa & 67.579 MPa respectively occurred at the skirt to dished end junction as shown in above figure, So the component stress range, ΔSP, k is 237.84 MPa.
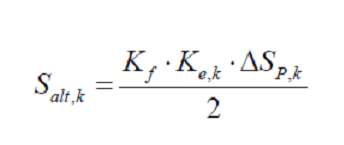
According to point number 5.5.3.2 (ASME Section VIII, Division 2, Part 5, Point 5.5.3.2) the effective alternating stress amplitude for the kth cycle.
Where,
ΔSP, k =237.84 N/mm2 ————(The component stress range between two-time point)
Kf = Fatigue Strength reduction factor = 1.2 (ASME Section VIII, Div. 2, Table 5.11)
Ke, k = Fatigue Penalty Factor = 1.0 (since ΔSn,k < SPS )
After solving this we get,
Salt, k = 142.70 N/mm2
To calculate the design no. of cycles following formula is used
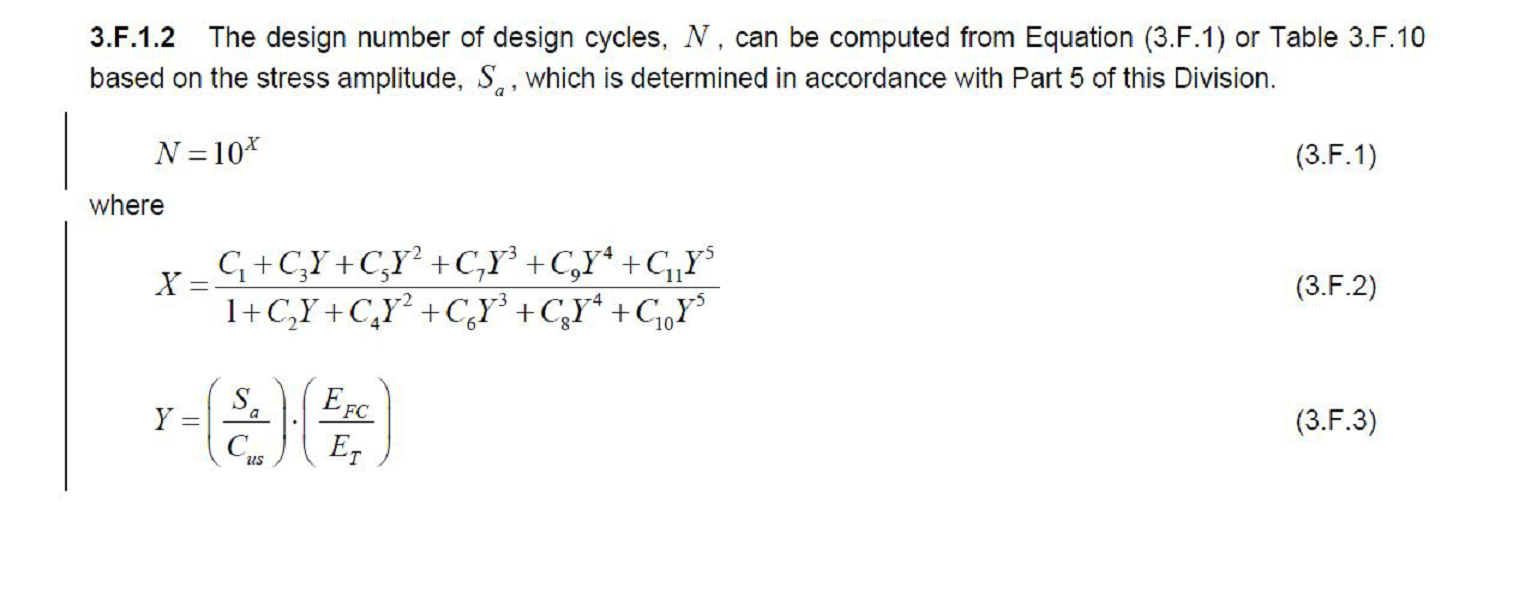
Where ET = Young’s modulus for material.
The coefficients C1, C2… are calculated from table 3.F.1 – Coefficient of fatigue curves.
After solving the above equations, we get,
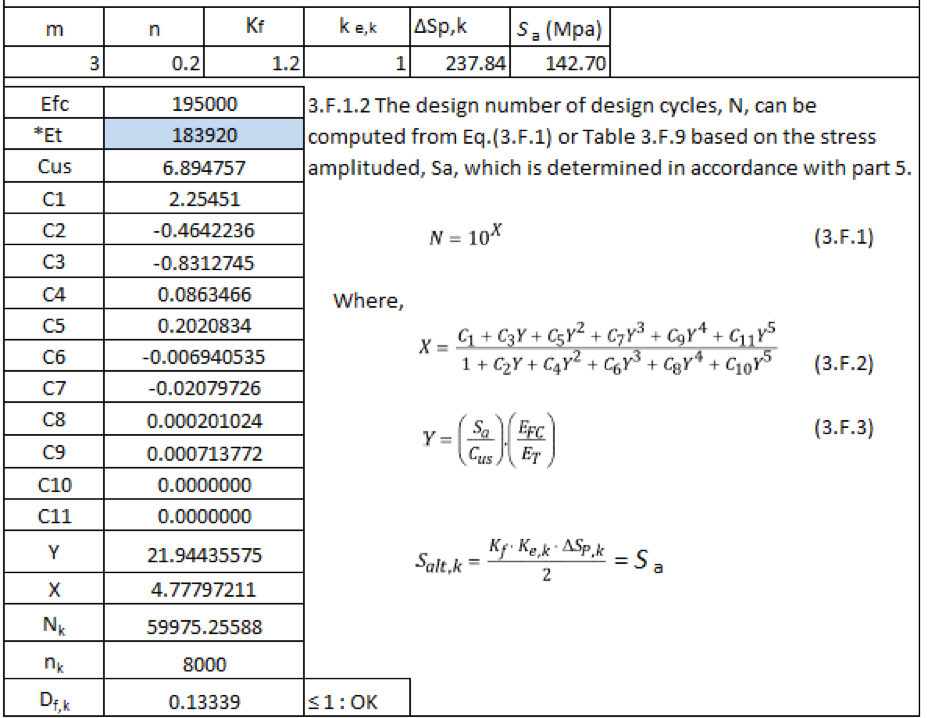
*Et is considered at average cycle temperature.
The fatigue damage factor(Df,k) is 0.13339 which is much less than unity.
As fatigue damage factor is much less than unity, the design is safe.
Creep-Fatigue damage factor calculation as per API 579 Cl 10.5.2.4 (c) For Skirt to dish end junction
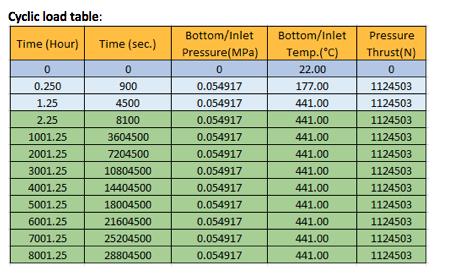
Cycle Explanation:
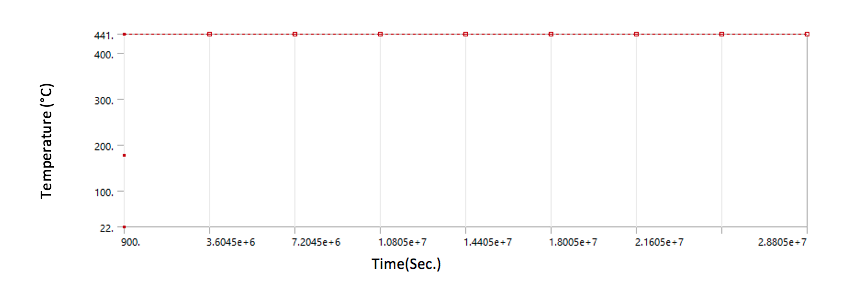
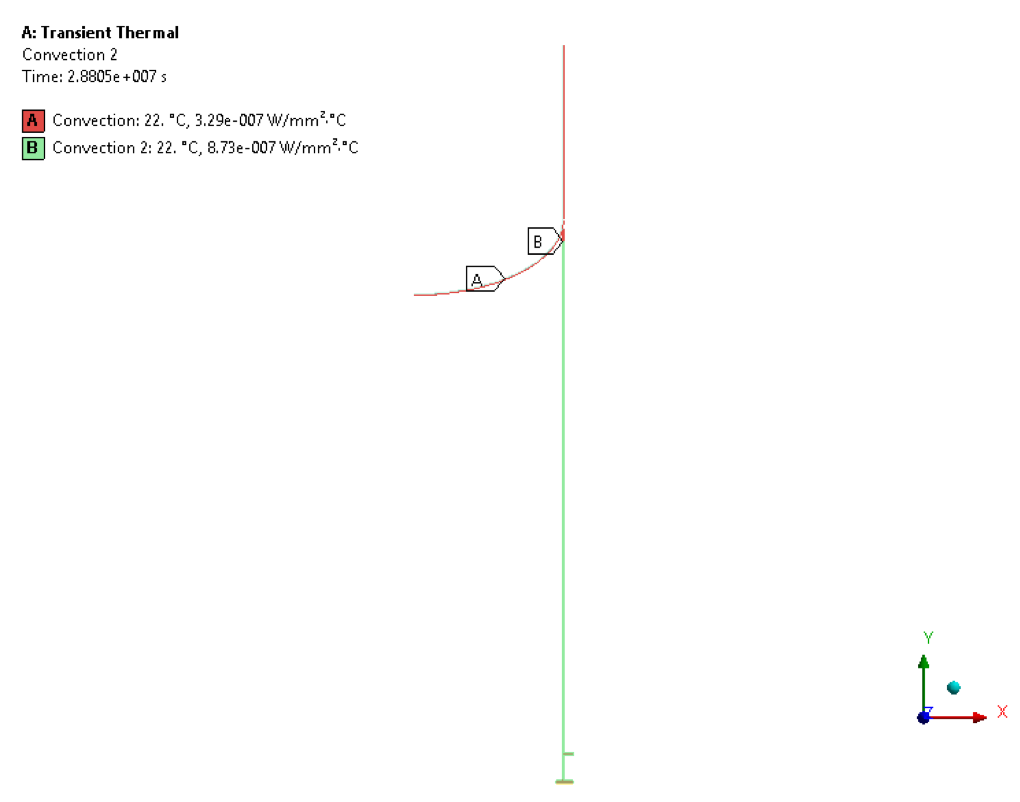
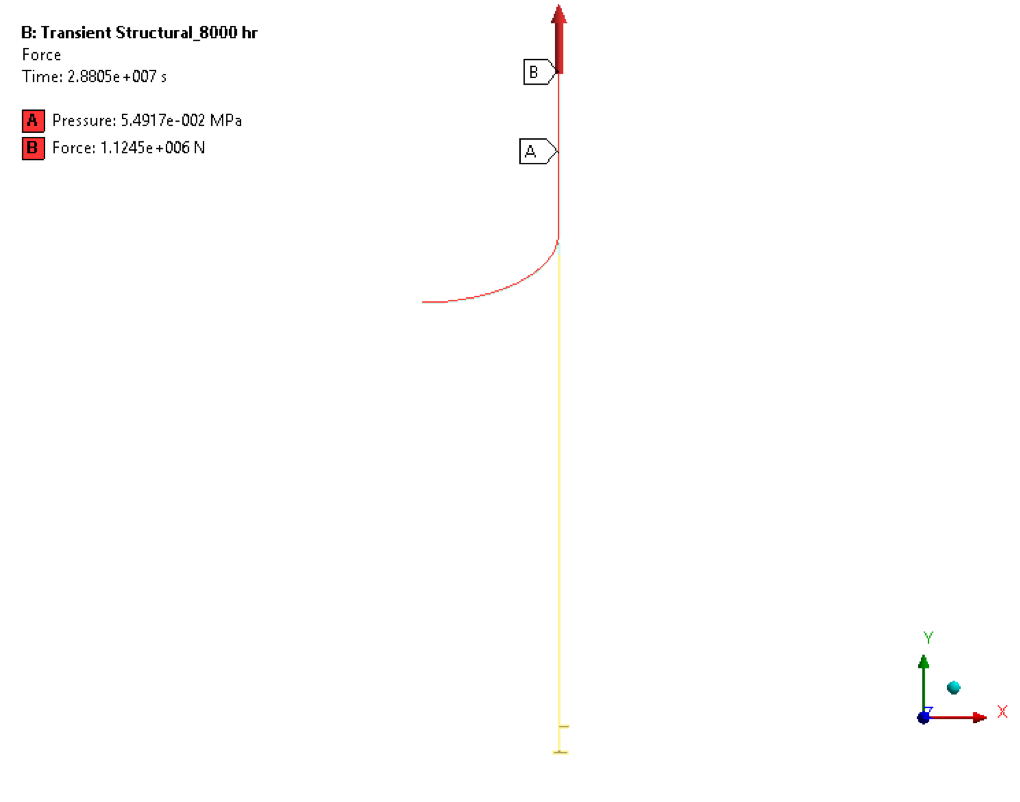
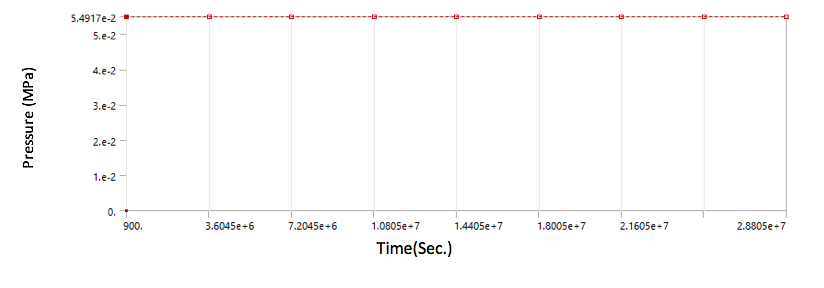
The cycle starts with 177 °C & after reaching 441°C in one hour, the cycle will hold at 441°C for next 8000 hours (assuming it as a maximum time of creep range in entire 8000 cycles). Additional 15 min is included at starting the cycle to stabilize temperature from ambient to 177°C. Pressure (0.054917 MPa) is considered throughout the cycle
Loading & Boundary Condition –
• Transient Thermal load – Temperature
• Transient Thermal load – Convection
• Transient Structural Load – Internal Pressure
• Transient Structural boundary condition
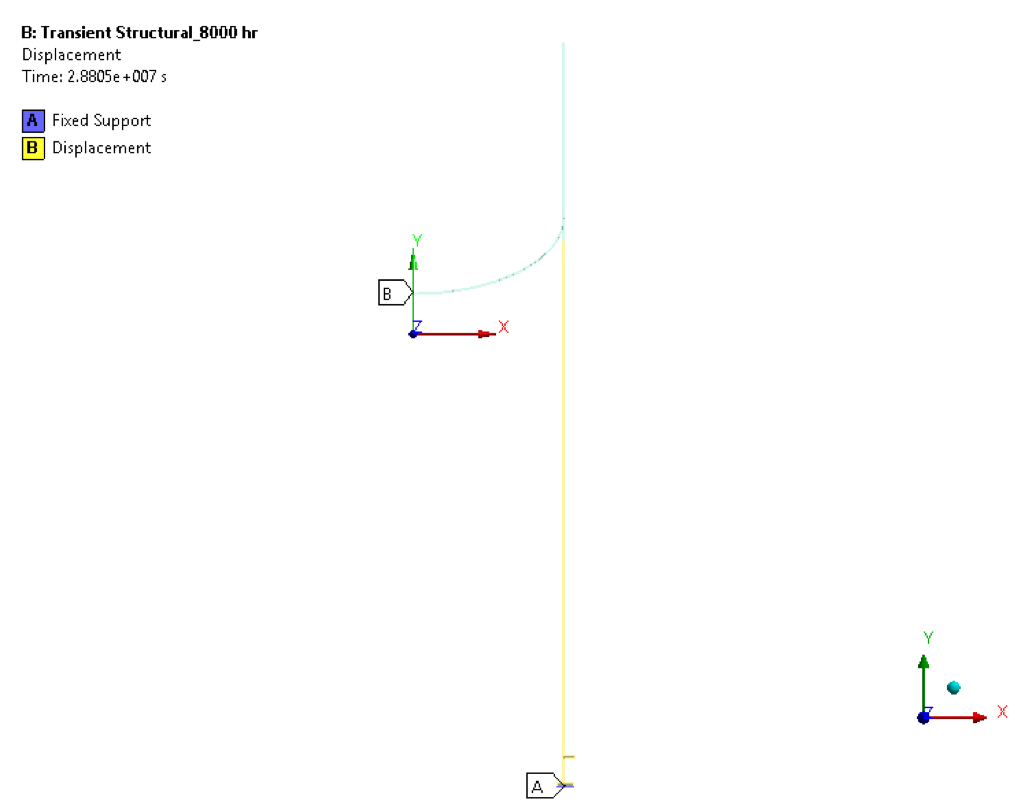
Note: In displacement boundary condition, X-directional displacement is constrained and Y-directional displacement is Free.
Results –
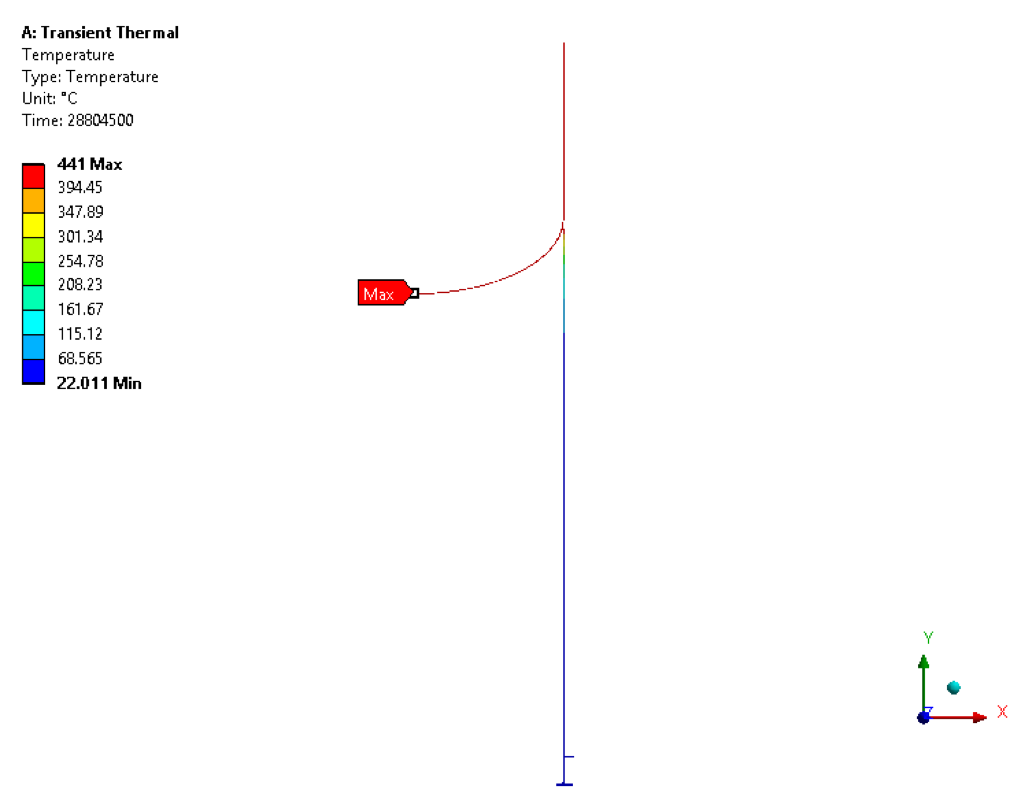
• Transient Thermal plot for the cycle
![]()
• Temperature counter plot at the end of the cycle
• Transient Equivalent Von Mises Stress plot for cycle
• Maximum Equivalent Von Mises Stress plot at the end of the cycle
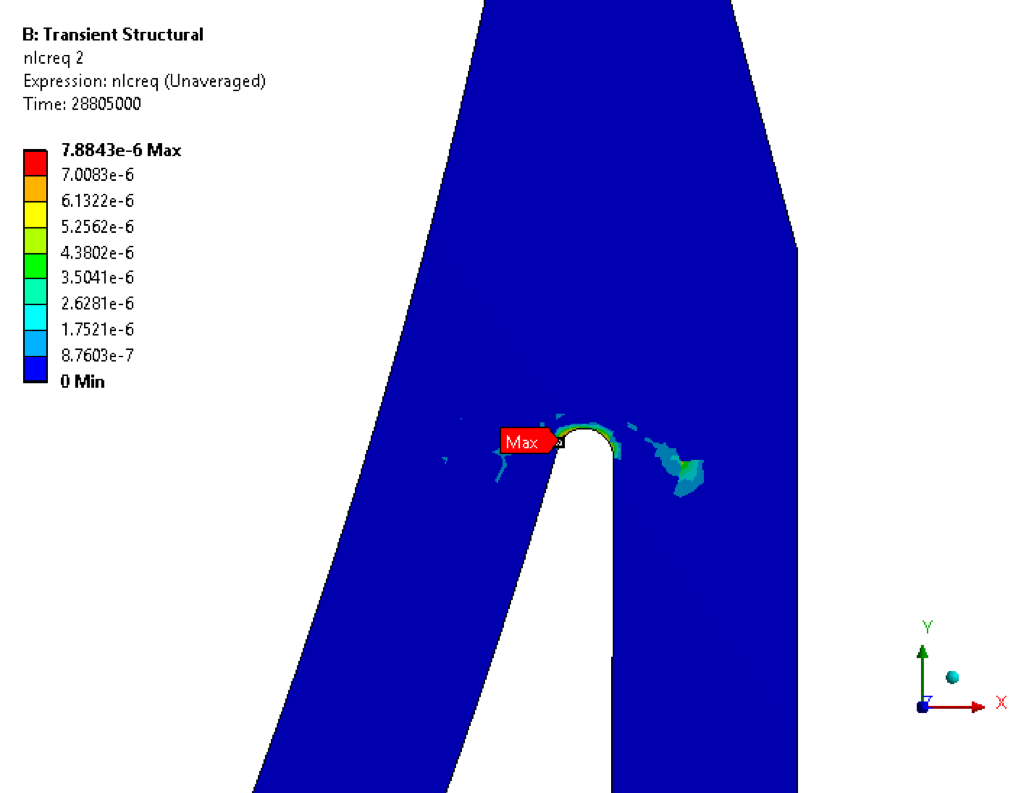
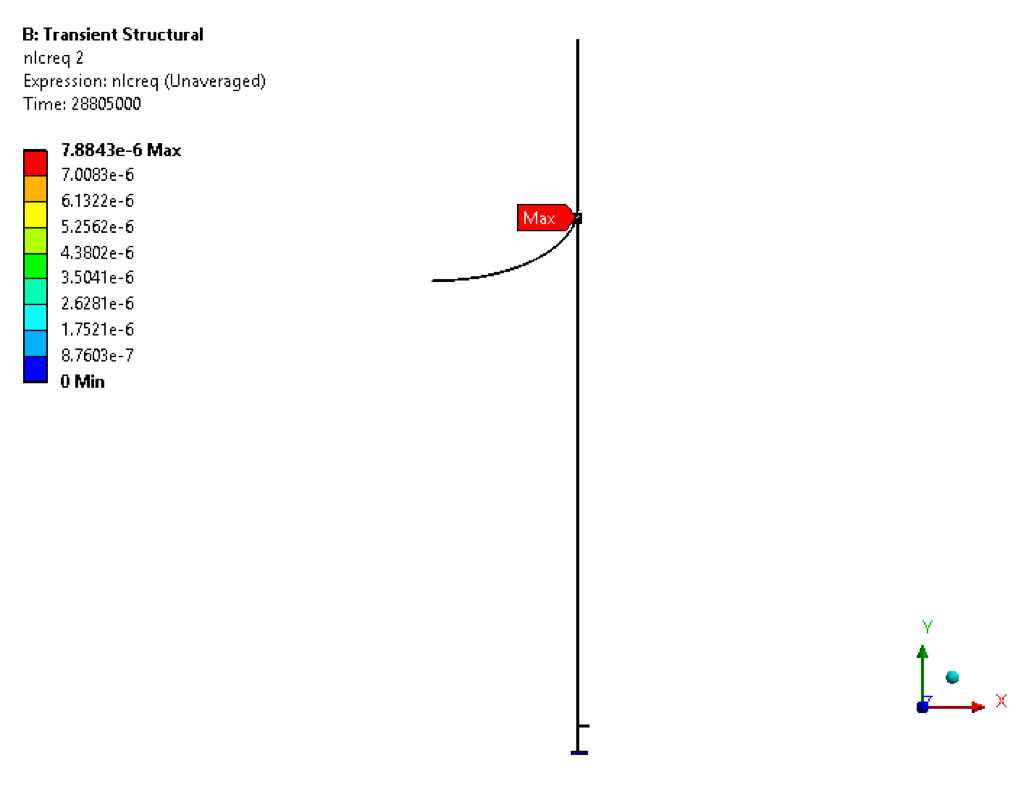
• Accumulated inelastic (creep) strain plot at the end of the cycle
Creep damage factor calculation as per API 579 Cl 10.5.2.4 (C)
Solver Output Result (MPC Omega Method Output from Finite Element Analysis Software):
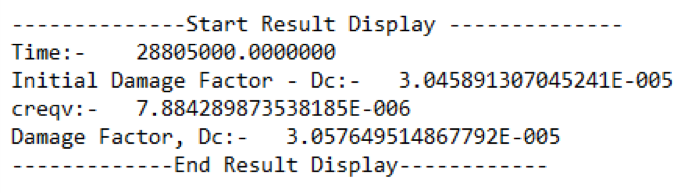
Creep damage factor(Dc) is 3.058E-05 at the end of the cycle and total accumulated inelastic (creep) strain is 7.88E-06. So, as per API 579 CL 10.5.2.4 (g) for total creep damage(3.058E-05) & total accumulated inelastic strain(7.88E-06) are satisfied the limit DcAllow=1 & the equivalent total accumulated inelastic strain (0.005) respectively. As the design is acceptable for this loading conditions.
As per 10.5.3 Creep-Fatigue Interaction, Creep damage factor (3.058E-05) and fatigue damage factor (0.13339) are lying down in the chart of figure 10.29 (creep-fatigue damage criteria) for carbon steel. Thus, the design is acceptable for this loading conditions.